
Search “coffee consumption by country” and you will find Finland in first place. Search it again on a different site and you will find Luxembourg in first place, sometimes with Finland demoted to second or third. Both claim to be measuring the same thing, per-person coffee consumption, and both point back to the same underlying data provider, the International Coffee Organization. They still cannot agree on who drinks the most coffee on earth. That disagreement is not a typo on one site and a correction on the other. It is two publishers making two different, defensible choices about how to turn trade statistics into a per-person number, and the choices produce genuinely different winners.
This is worth untangling because “coffee consumption by country” gets cited constantly, in marketing copy, in trivia, in roastery about pages, almost always as a single confident number with no methodology attached. Once you have seen how many different ways there are to build that number, you will read every version of it differently.
Where the published numbers actually land
WorldAtlas publishes a ranking it explicitly attributes to the International Coffee Organization per-capita-consumption measure, pounds of coffee per person per year, calculated by dividing a country’s consumption against its total resident population. On that measure, Finland leads at 26 to 29 pounds a year, followed by Norway and Sweden at 22 pounds, Iceland at 19, Denmark at 17 to 19, the Netherlands at 18, Switzerland at 17, Belgium at 15, and Canada at 14. Luxembourg appears further down, at 14 to 15 pounds, and WorldAtlas labels that figure “residents only,” a flag worth remembering for the next section.
Cafely publishes a different-looking ranking built, by its own account, from the same starting point: “coffee consumption figures were collected from International Coffee Organization” data. But instead of stopping at pounds per year, Cafely converts everything into cups per day, using a stated assumption of 10.6 grams of ground coffee per standard cup. On that ranking, Luxembourg is first, at 5.31 cups a day, well ahead of Finland’s 3.77, with Sweden and Norway close behind at roughly 2.6 cups a day each. The United States lands 24th, at 1.22 cups a day.
Then there is the total-volume view, which is a different question entirely: not who drinks the most per person, but which country’s population drinks the most coffee in aggregate. World Population Review’s country rankings page lists total national coffee consumption in tonnes, and by that measure the United States leads at roughly 1,431,000 tonnes, followed by Brazil at about 1,061,000 tonnes, then the Philippines, Germany, Vietnam, and Italy. Neither the United States nor Brazil appears anywhere near the top of either per-capita list above. Both things are true at once: Americans and Brazilians drink an enormous amount of coffee in total, and a comparatively ordinary amount each.
And then there is a fourth layer, sites that publish a ranking without saying where the numbers came from at all. A widely syndicated piece attributed to the research site Wisevoter lists Finland at 9.6 kilograms a year, Norway at 7.2, the Netherlands at 6.7, Sweden at 6.5, and Slovenia at 6.1, with no explanation of whether that is trade data, survey data, or something else, and no link to a primary source. It is a plausible-looking table that cannot actually be checked, and it gets reposted across dozens of coffee blogs as though it were settled.
Four sources, four visibly different pictures of the same question, and not one of them is fabricating anything. They are measuring, converting, and populating the denominator differently.
Per capita and total volume are different questions
The simplest source of confusion is also the easiest to fix: per-capita rankings and total-volume rankings answer different questions and should never be read as the same ranking. A country the size of the United States can drink more coffee than the entire population of Finland combined and still land outside the per-capita top twenty, because the per-capita number divides by roughly 340 million people rather than 5.6 million. World Population Review’s tonnage table and its own per-capita table, drawn from the same broad dataset, tell opposite-looking stories for the same countries for exactly this reason. If a headline says “the country that drinks the most coffee” without specifying per person or in total, treat that as an incomplete sentence rather than a fact.
The Luxembourg problem

Luxembourg is the cleanest illustration of why per-capita numbers can mislead even when the underlying trade data is accurate. It is a small country, home to roughly 660,000 residents, that also hosts an enormous daily flow of cross-border commuters from France, Belgium, and Germany, plus significant duty-free and re-export trade. Coffee bought, sold, and consumed by that non-resident traffic still shows up in Luxembourg’s national trade statistics. Divide that total by the resident population alone, rather than by everyone actually drinking coffee inside the country’s borders on a given day, and the per-capita figure inflates sharply, not because Luxembourgers personally drink more coffee than Finns, but because the denominator undercounts who is actually consuming it.
WorldAtlas appears to handle this by flagging its Luxembourg figure as “residents only” and ranking it ninth, behind Finland, Norway, Sweden, Iceland, Denmark, the Netherlands, Switzerland, and Belgium. Cafely does not make that same adjustment, or at least does not describe one, and its Luxembourg figure of 5.31 cups a day comes out roughly 40 percent higher than Finland’s, enough to flip the two countries’ order entirely. Back-calculating Cafely’s own stated formula, cups per day multiplied by 365 days and by its 10.6-gram cup weight, gives an implied Luxembourg consumption of about 20.5 kilograms a year, against WorldAtlas’s residents-only figure of roughly 6.4 to 6.8 kilograms for the same country. That is not a rounding difference. It is two publishers making two different calls about whether to correct for a small, trade-heavy country’s population mismatch, and neither call is stated plainly enough for a reader to catch it without comparing sources directly, which is exactly what most readers of a single ranking never do.
The same distortion risk applies, to a lesser degree, to any small country that also functions as a coffee trading, roasting, or re-export hub. The number a trade-based ranking assigns to that country is a measure of coffee moving through its ports and shops, not necessarily coffee consumed by the people who live there.
It is worth separating this from a related but different question: where coffee is grown rather than where it is drunk. Finland and Luxembourg do not grow coffee at all; they import all of it. If you want the origin side of the story, our origin atlas covers the growing countries, Ethiopia, Kenya, Colombia, Brazil, and others, and what altitude, variety, and processing do to flavor. That is a genuinely separate topic from the consumption rankings here, even though both involve “coffee by country.”
Self-reported surveys measure a different thing
Trade data is not the only way these rankings get built. The National Coffee Association’s National Coffee Data Trends survey, fielded in January 2025 by Dig Insights on behalf of the NCA, asks American adults directly what they drank yesterday, rather than inferring consumption from import and export tonnage. Its headline finding: 66 percent of American adults drank coffee the previous day, more than any other beverage tracked, including bottled water, and the average coffee drinker in that survey reported three cups a day.
That is a genuinely different measurement from a trade-based per-capita figure, and it can point in a different direction. On the trade-based rankings above, the United States sits well outside the per-capita top twenty, at roughly 9 to 14 pounds a year depending on the source, or 24th on Cafely’s cups-per-day list at 1.22 cups a day averaged across the entire population, drinkers and non-drinkers alike. But the NCA’s survey-based 66 percent daily participation rate, and three cups a day among people who do drink it, describes a population where coffee drinking is extremely common, just not extremely heavy in volume compared with the Nordic countries at the top of the trade-based lists. Both descriptions of American coffee habits are accurate. They answer different questions: how much coffee moved through the supply chain per resident, versus how many people say they personally drank a cup yesterday.
Self-report surveys carry their own distortions, mainly recall bias and whatever sample the survey used, but they avoid the trade-data problem entirely, because they ask people what they actually drank rather than inferring it from a customs form. Neither method is more “real” than the other. They are simply not interchangeable, and a ranking built one way cannot be quoted as though it came from the other.
When a chart does not say where its numbers came from
The hardest sources to evaluate are the ones that state a confident number with no visible methodology at all. The Wisevoter-attributed figures cited above, republished across multiple sites with identical numbers and no link back to a named dataset, are a common pattern in this space: a table that looks authoritative, gets copied from blog to blog, and becomes harder to trace back to a primary source with every repost. None of the individual numbers are obviously wrong; Finland’s 9.6 kilograms a year is in the same rough neighborhood as WorldAtlas’s 11.8 to 13.2 kilogram range for Finland, just meaningfully lower. But “in the same rough neighborhood” is the best you can say about a number with no stated source, and that is a real gap from a ranking that tells you exactly which trade dataset, population figure, and conversion factor it used.
The reconciliation table
Converting every figure above to kilograms per person per year, using each source’s own stated units and, for Cafely, its own stated cup-weight formula, makes the size of the disagreement easy to see directly.
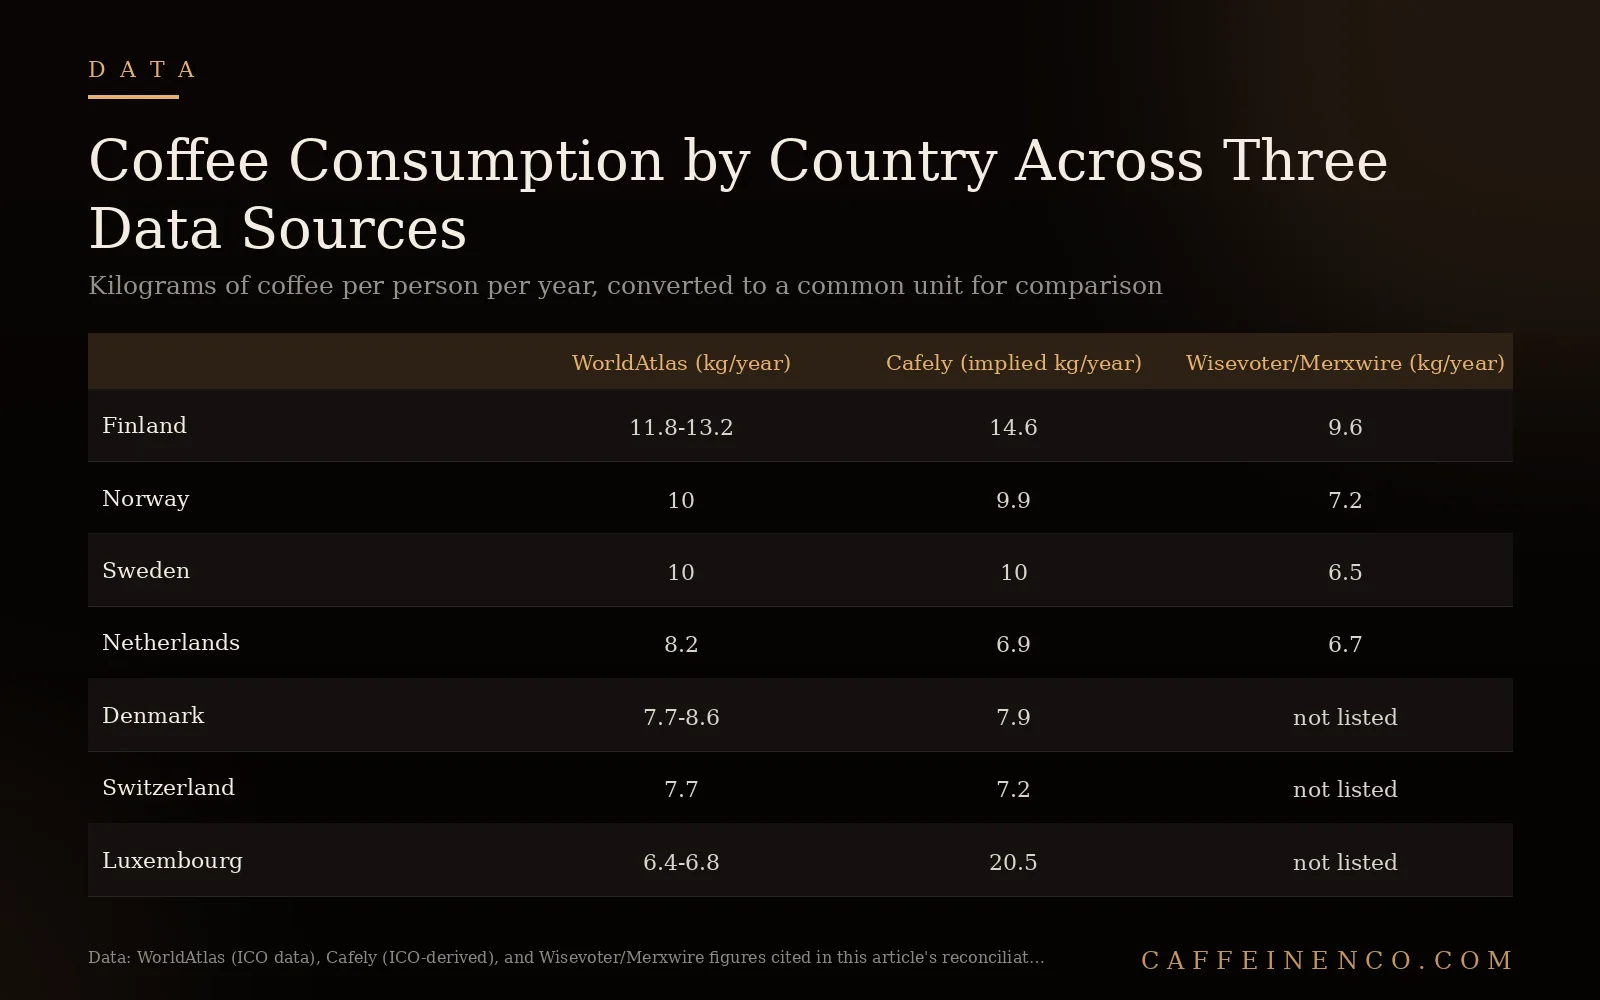
| Country | WorldAtlas (ICO, lbs/year converted to kg) | Cafely (ICO-derived cups/day, converted to kg) | Wisevoter/Merxwire (kg/year, source undisclosed) |
|---|---|---|---|
| Finland | 26-29 lbs, about 11.8-13.2 kg | 3.77 cups/day, implies 14.6 kg | 9.6 kg |
| Norway | 22 lbs, about 10.0 kg | 2.57 cups/day, implies 9.9 kg | 7.2 kg |
| Sweden | 22 lbs, about 10.0 kg | 2.59 cups/day, implies 10.0 kg | 6.5 kg |
| Netherlands | 18 lbs, about 8.2 kg | 1.79 cups/day, implies 6.9 kg | 6.7 kg |
| Denmark | 17-19 lbs, about 7.7-8.6 kg | 2.04 cups/day, implies 7.9 kg | not listed |
| Switzerland | 17 lbs, about 7.7 kg | 1.87 cups/day, implies 7.2 kg | not listed |
| Luxembourg | 14-15 lbs, residents only, about 6.4-6.8 kg | 5.31 cups/day, implies 20.5 kg | not listed |
Norway and Sweden agree closely between the two ICO-derived sources, within about a tenth of a kilogram, which is reassuring: when two publishers apply similar population adjustments to similar trade data, they land close together. Finland disagrees by roughly two kilograms between the same two sources, and Luxembourg disagrees by a factor of three, which is the whole story of this piece in one row of a table.
How to read any coffee-consumption-by-country stat you see in the wild
- Check whether the number is per capita or total volume. A country can rank first on one and nowhere near it on the other, and headlines routinely drop the distinction.
- Look for the unit. Kilograms of green coffee per year, cups per day, and retail sales value are three different measurements that do not convert cleanly into one another without a stated assumption, like Cafely’s 10.6 grams per cup.
- Find the population denominator. A small country with heavy cross-border trade, tourism, or commuting, Luxembourg being the clearest example, can post an inflated per-capita figure purely because its resident population is smaller than the population actually drinking the coffee counted in its trade data.
- Ask whether it is trade data or a survey. Import and export tonnage measures what moved through the supply chain; a survey like the NCA’s National Coffee Data Trends measures what people say they drank. Both are legitimate, and they are not the same measurement.
- Look for a named primary source. “The International Coffee Organization” or “the NCA’s National Coffee Data Trends” is a source you can go verify. “Data show” or an uncredited table that matches five other uncredited tables is not, and probably traces back to one of those tables copied without attribution.
Our reconciled read

If you want a single honest answer to “which country drinks the most coffee per person,” it is Finland, on the population-adjusted sources in this piece rather than raw trade flow through a small country’s borders. The Nordic cluster, Finland, Norway, Sweden, Iceland, and Denmark, plus the Netherlands and Switzerland, shows up near the top of the per-capita rankings across most methodologies, which is meaningful evidence: independent sources converging despite different units and conversion assumptions, with the exceptions themselves explainable by the trade-flow artifacts described above. Luxembourg’s apparent lead in some rankings is a real number, not a fabricated one, but it is a number that measures trade flow through a small, commuter-heavy country more than it measures what Luxembourg’s own residents personally drink, and treating it as equivalent to Finland’s figure means comparing two different things. World Population Review’s page also republishes a separate per-person top 10 it attributes to the International Coffee Organization’s 2022 figures, led by the Central African Republic at 52.1 kg, then Belize, the Marshall Islands, and Luxembourg, with Finland absent entirely. Read that list with the same lens: extreme per-capita numbers out of very small or thinly reported markets are what import-divided-by-population math produces at its limits, and the fact that it disagrees so sharply with the population-adjusted rankings above is the clearest demonstration in this piece that methodology, not national coffee thirst, decides who tops these tables. If the question is which country’s population drinks the most coffee in total, the answer flips entirely, to the United States and Brazil, both of which are unremarkable on a per-person basis. And if the question is what share of a population drinks coffee on a given day, the NCA’s survey-based number for the United States, 66 percent, is a genuinely different, equally valid answer to a genuinely different question.
Common questions
Which country actually drinks the most coffee? Depends what you mean. Per person, using trade-data-based rankings that adjust for resident population, Finland leads across the population-adjusted sources in this piece. In total volume, the United States and Brazil lead by a wide margin, because of population size rather than individual habits. There is no single correct answer without specifying which of those two questions you are asking.
Why does Luxembourg sometimes rank first and sometimes rank ninth? Because some publishers divide Luxembourg’s trade-based coffee data by its resident population alone, which is small relative to the coffee moving through the country via commuters, tourism, and re-export trade, while others adjust or flag that distortion. The unadjusted calculation produces a much higher, and less meaningful, per-resident figure.
Is the National Coffee Association’s survey data comparable to the trade-based rankings? No, and that is the point. The NCA’s National Coffee Data Trends survey asks American adults what they drank yesterday, producing a participation rate, 66 percent of adults drank coffee daily as of its Spring 2025 report, and a cups-per-drinker figure. Trade-based rankings divide national import and consumption tonnage by total population. Both are legitimate measurements of American coffee habits; they simply measure different things and should not be quoted against each other.
Can I trust a ranking that does not name its data source? Treat it as unverified until you can trace it back to a named primary source, like the International Coffee Organization, USDA’s Foreign Agricultural Service, or a named, dated survey. Numbers that get reposted across many sites with identical figures and no attribution are often copies of a single original table, accurate or not, rather than independent confirmations of the same fact.
Does a higher per-capita number mean people in that country drink stronger coffee? No. These rankings measure quantity, kilograms or cups per person, not strength or caffeine concentration. A country could rank high on volume while brewing weak coffee in large servings, or rank lower while brewing strong coffee in small ones; the rankings in this piece say nothing about either. For how caffeine content itself gets measured and misquoted, see our breakdown of cold brew caffeine content, a similar reconciliation problem in a different corner of coffee data.
Sources & data
- WorldAtlas: The Top Coffee-Consuming Countries
- Cafely: Coffee Consumption by Country 2025, Lifetime Data and Statistics
- World Population Review: Coffee Consumption by Country 2026
- National Coffee Association, Spring 2025 National Coffee Data Trends, via PR Newswire
- Merxwire, ranking of countries with the most coffee drinkers, syndicated via Financial Content